How Big Tech Makes Money: Analyzing Revenue Streams and Profit Margins of Tech Giants
How Big Tech Makes Money: Analyzing Revenue Streams and Profit Margins of Tech Giants
Blog Article
Ever wonder how tech bros afford those $19 smoothies and ergonomic standing desks? Turns out, it's because their companies are absolutely raking it in. We're talking hundreds of billions in revenue and profit margins that would make your financial advisor weep tears of joy.
Today, we're diving into the money machines of Silicon Valley's elite – NVIDIA, Apple, Microsoft, Meta, Amazon, Google, and Tesla – to see exactly how they're turning your screen time into shareholder champagne time. Spoiler alert: those targeted ads and cloud subscription fees add up faster than your weekend Uber Eats tab.
NVIDIA: The Data Center Powerhouse
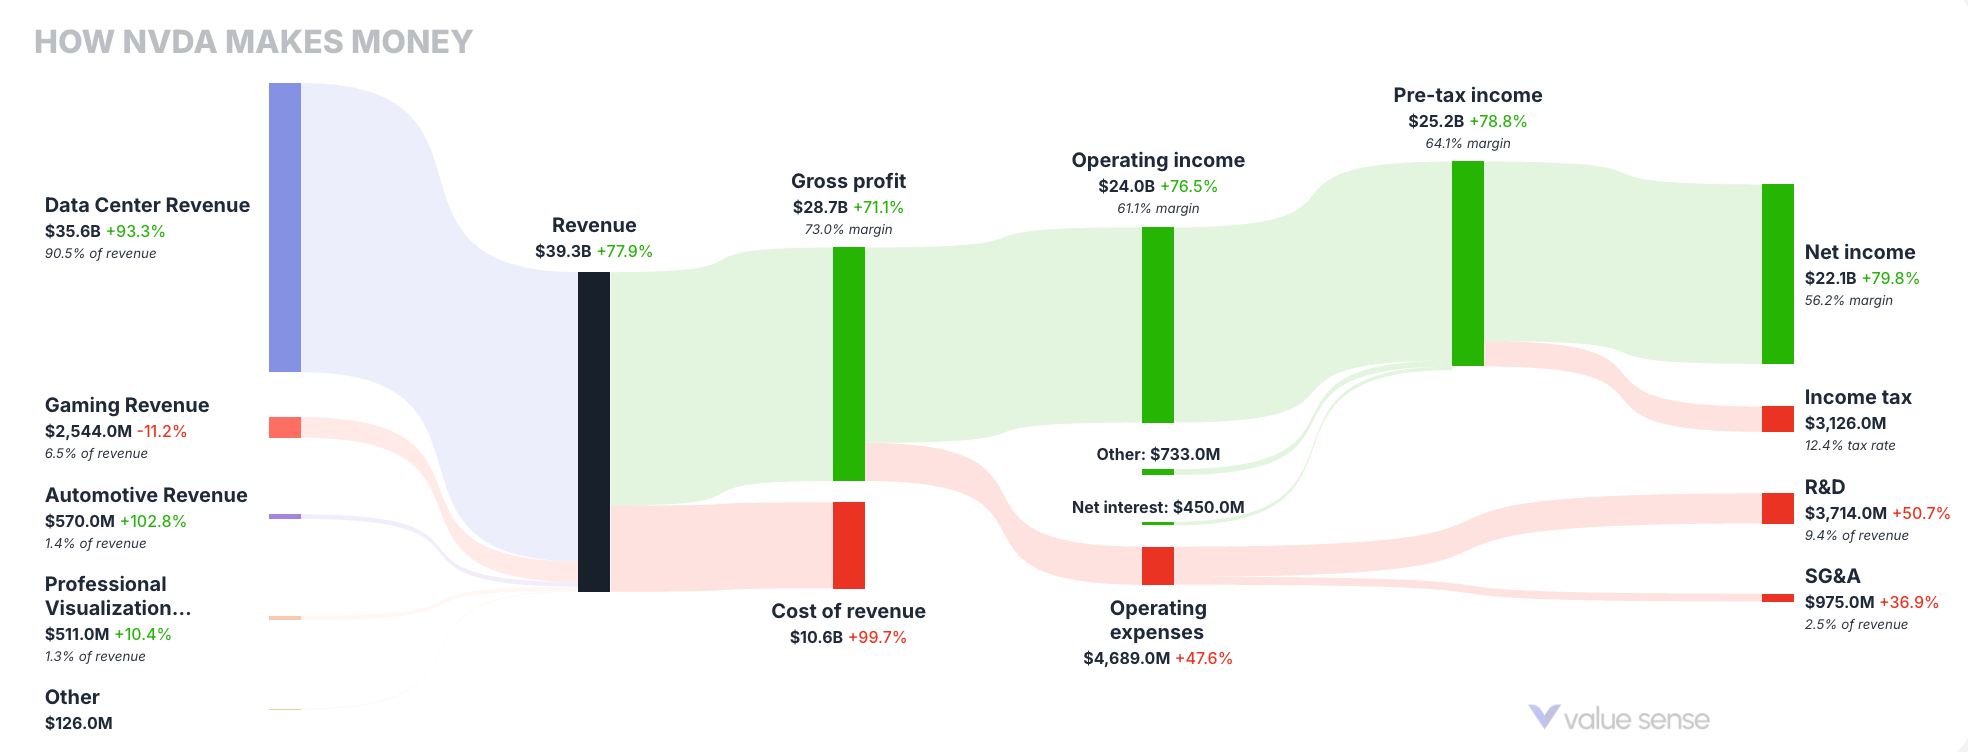
- Total Revenue: $39.3B (+77.4% growth)
- Data Center Revenue: $35.6B (+83.3%) – making up 90.6% of total revenue
- Gaming Revenue: $2.54B (+1.2%) – representing only 6.5% of revenue
- Net Income: $27.1B (+291.2%) with an impressive 68.7% margin
NVIDIA's remarkable pivot to data center technology has paid off enormously, with their AI chips now powering everything from cloud computing to machine learning applications, resulting in nearly 300% net income growth.
Apple: Services Growth Complementing Hardware
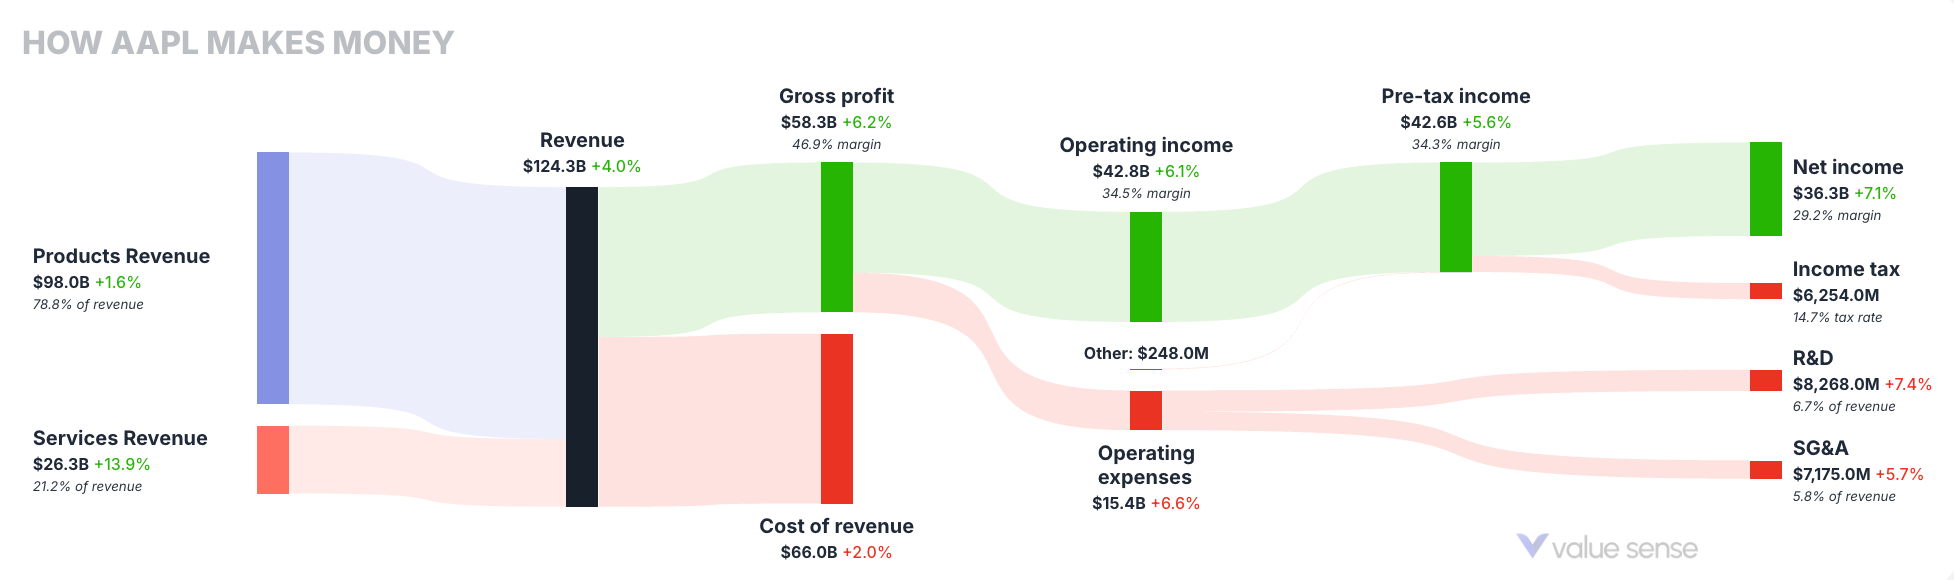
- Total Revenue: $124.3B (+10.0%)
- Products Revenue: $98.0B (+6.8%) – 78.8% of total revenue
- Services Revenue: $26.3B (+15.9%) – 21.2% of revenue and growing faster
- Net Income: $36.3B (+11.1%) with a 29.2% margin
While Apple's hardware remains its primary revenue source, the services segment (including App Store, Apple Music, iCloud, etc.) is growing at more than double the rate, highlighting Apple's successful diversification strategy.
Microsoft: Cloud Leadership Driving Growth
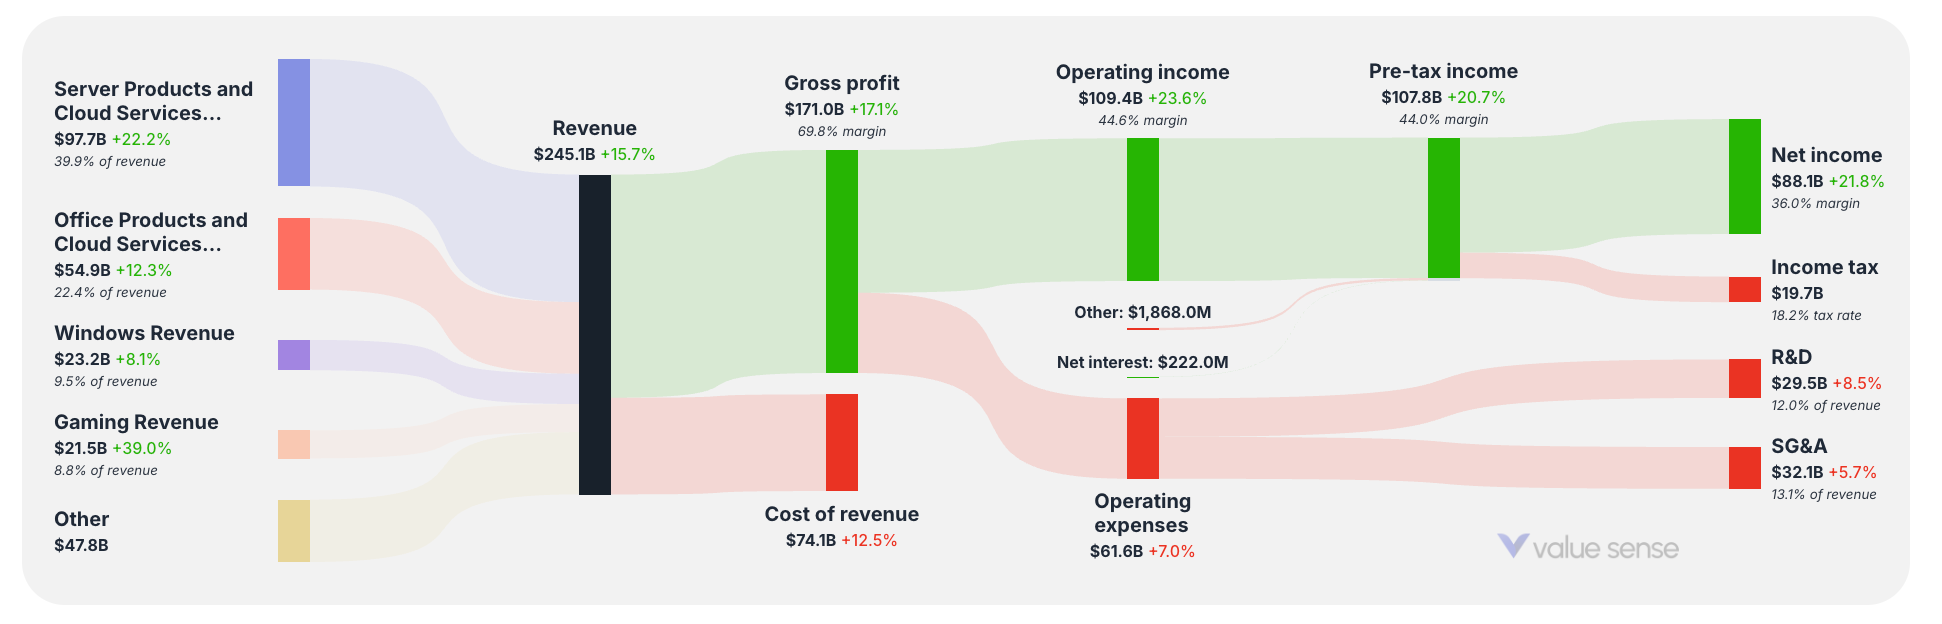
- Total Revenue: $245.1B (+15.7%)
- Server Products and Cloud Services: $97.7B (+22.2%) – 39.9% of total revenue
- Office Products and Cloud Services: $54.9B (+12.3%) – 22.4% of revenue
- Windows Revenue: $23.2B (+8.1%) – 9.5% of revenue
- Gaming Revenue: $21.5B (+39.0%) – 8.8% of revenue and fastest-growing segment
- Net Income: $88.1B (+21.8%) with a 36.0% margin
- R&D Investment: $29.5B (+8.5%) representing 12.0% of revenue
Microsoft's balanced business model shows impressive growth across all segments, with gaming (likely boosted by the Activision Blizzard acquisition) growing at a blistering 39%. Their cloud empire continues to be the bedrock of their success, contributing nearly 40% of total revenue with over 22% growth. With a 36% profit margin on a $245B revenue base, Microsoft's money printer is operating at full capacity.
Meta: Advertising Giant Achieving Remarkable Growth
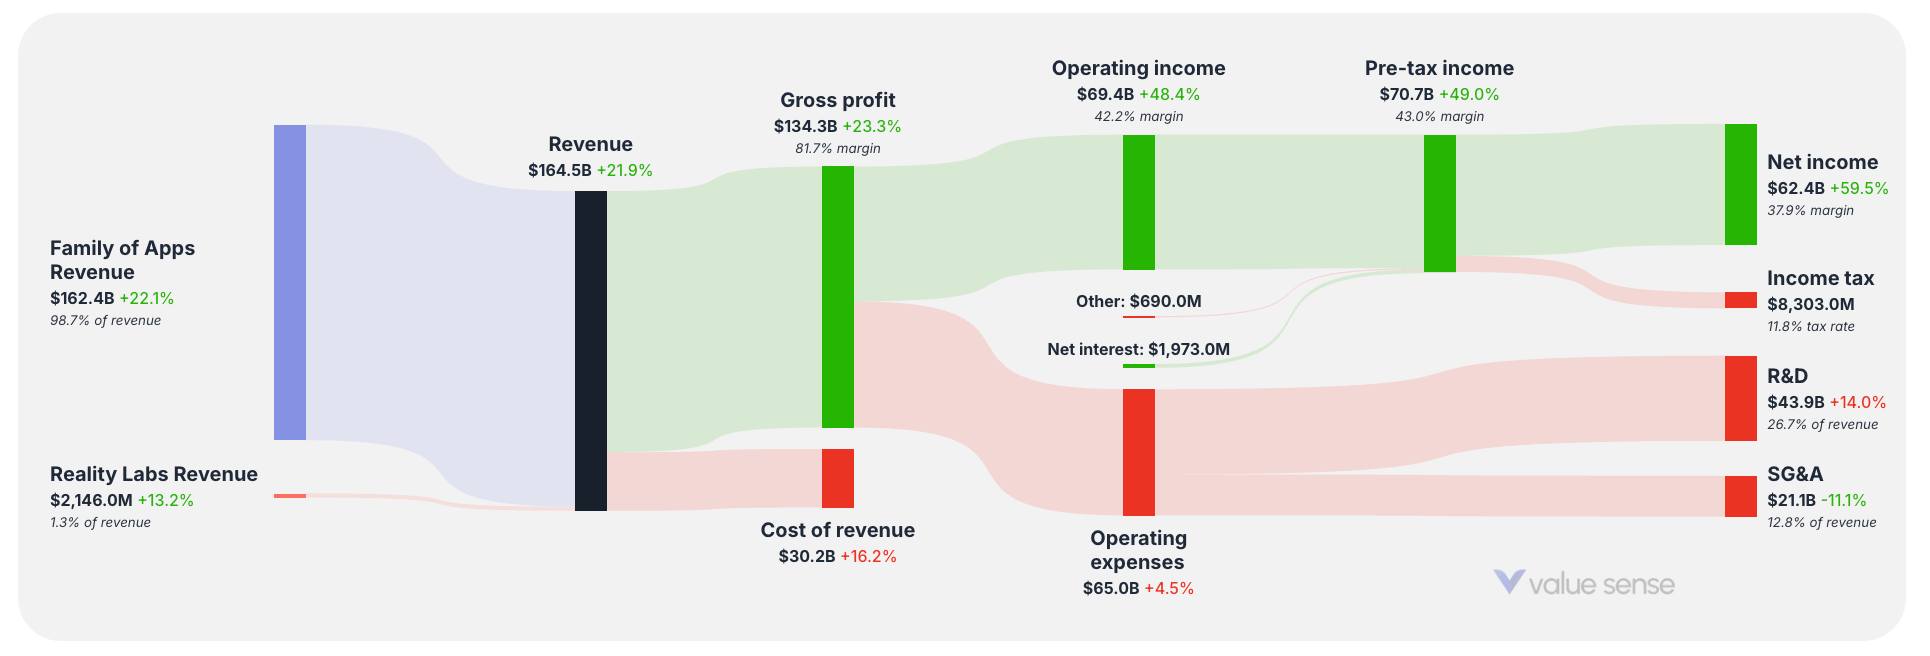
- Total Revenue: $164.5B (+21.9%)
- Family of Apps Revenue: $162.4B (+22.1%) – making up 98.7% of total revenue
- Reality Labs Revenue: $2.15B (+13.2%) – representing just 1.3% of revenue
- Gross Profit: $134.3B (+23.3%) with an 81.7% margin
- Net Income: $62.4B (+59.5%) with a 37.9% margin
- R&D Investment: $43.9B (+14.0%) representing 26.7% of revenue
Meta's dramatic revenue growth is primarily driven by its Family of Apps (Facebook, Instagram, WhatsApp, Messenger), which generate almost 99% of the company's revenue. Despite Reality Labs showing 13.2% growth, it remains a tiny fraction of Meta's business. The company continues to invest heavily in R&D at $43.9B, demonstrating its commitment to future technologies while maintaining impressive profitability from its core advertising business.
Amazon: Diversified Revenue Beyond E-commerce
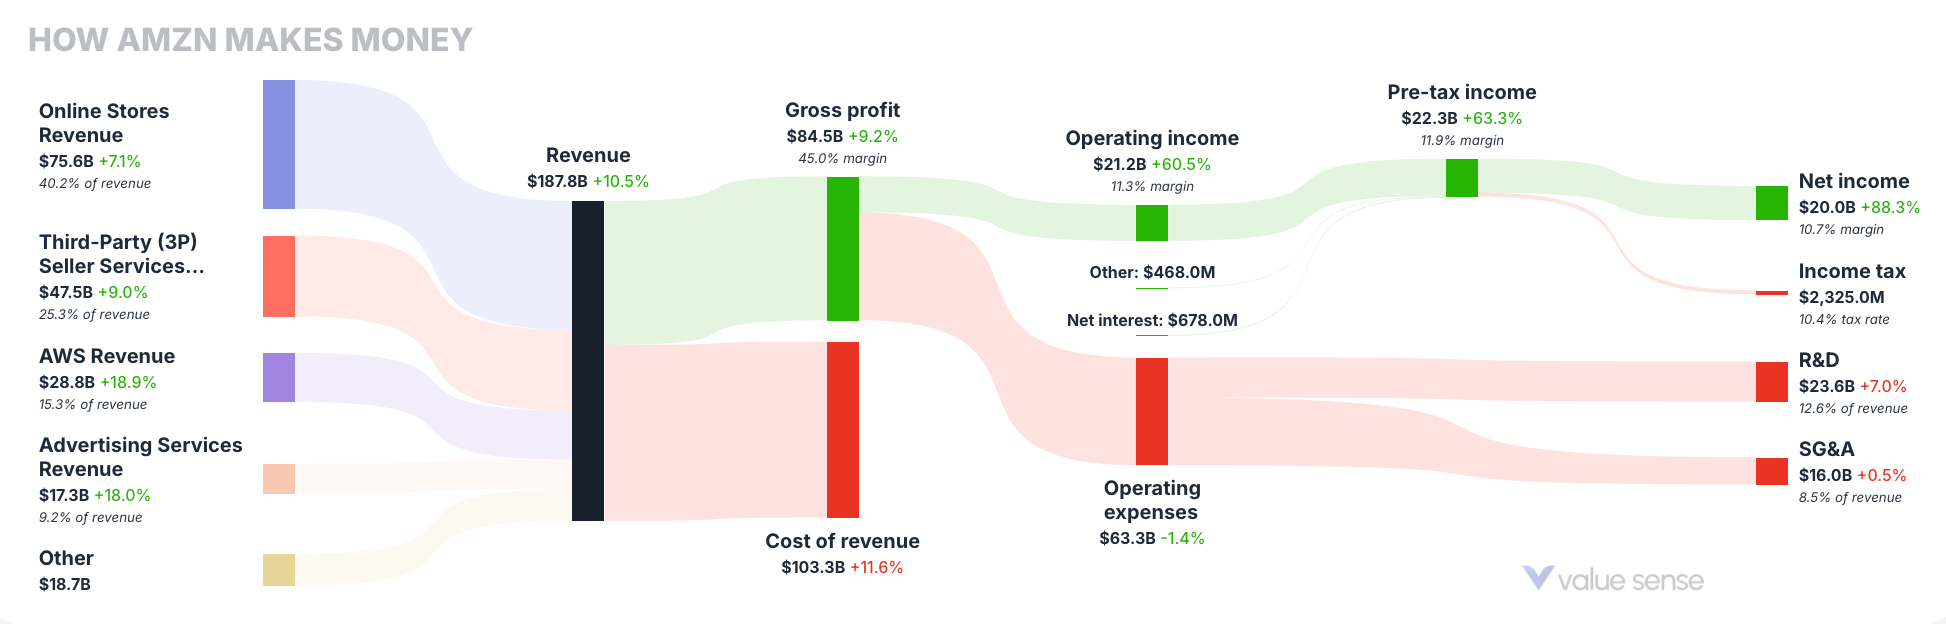
- Total Revenue: $157.8B (+9.3%)
- Online Stores: $75.6B (+2.1%) – 47.9% of revenue
- Third-Party Seller Services: $44.9B (+9.1%) – 28.5% of revenue
- AWS: $28.8B (+19.9%) – 18.3% of revenue and highest growth segment
- Net Income: $14.0B (+34.5%) with an 8.9% margin
While Amazon's e-commerce remains its largest business, AWS (cloud services) continues to be the fastest-growing and highest-margin segment, contributing significantly to overall profitability.
Google: Search and Advertising Dominance
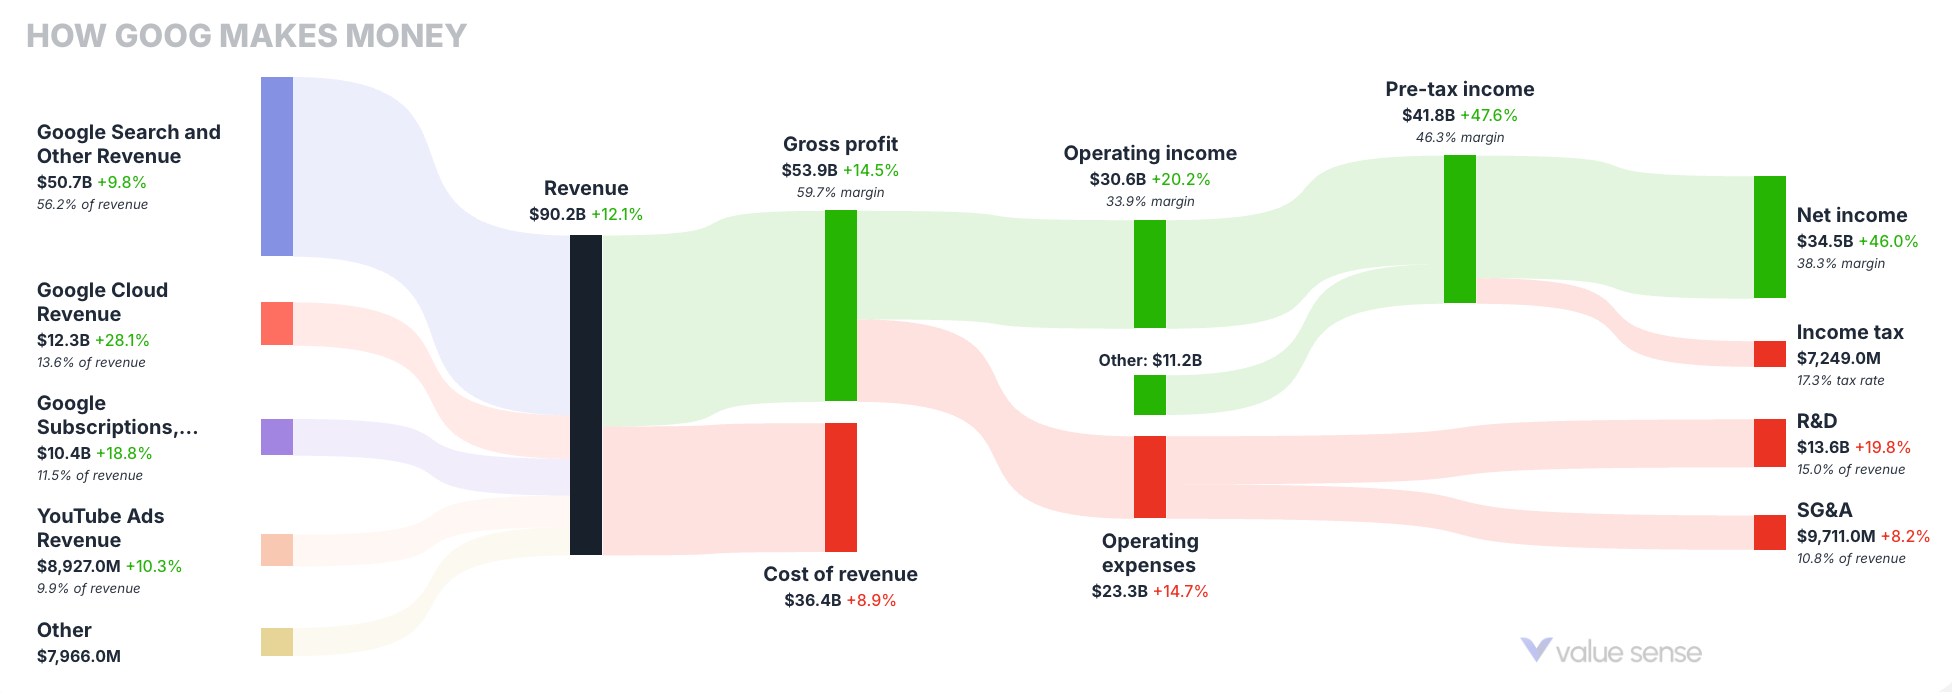
- Total Revenue: $90.2B (+12.1%)
- Search and Other Revenue: $50.7B (+8.8%) – 56.2% of total revenue
- Google Cloud: $12.3B (+28.1%) – fast-growing at 13.6% of revenue
- YouTube Ads: $8.9B (+10.3%) – 9.8% of revenue
- Net Income: $34.5B (+10.0%) with a 38.3% margin
Despite diversification efforts, Google's search advertising remains its profit engine with cloud services showing the strongest growth potential.
Tesla: More Than Just Cars
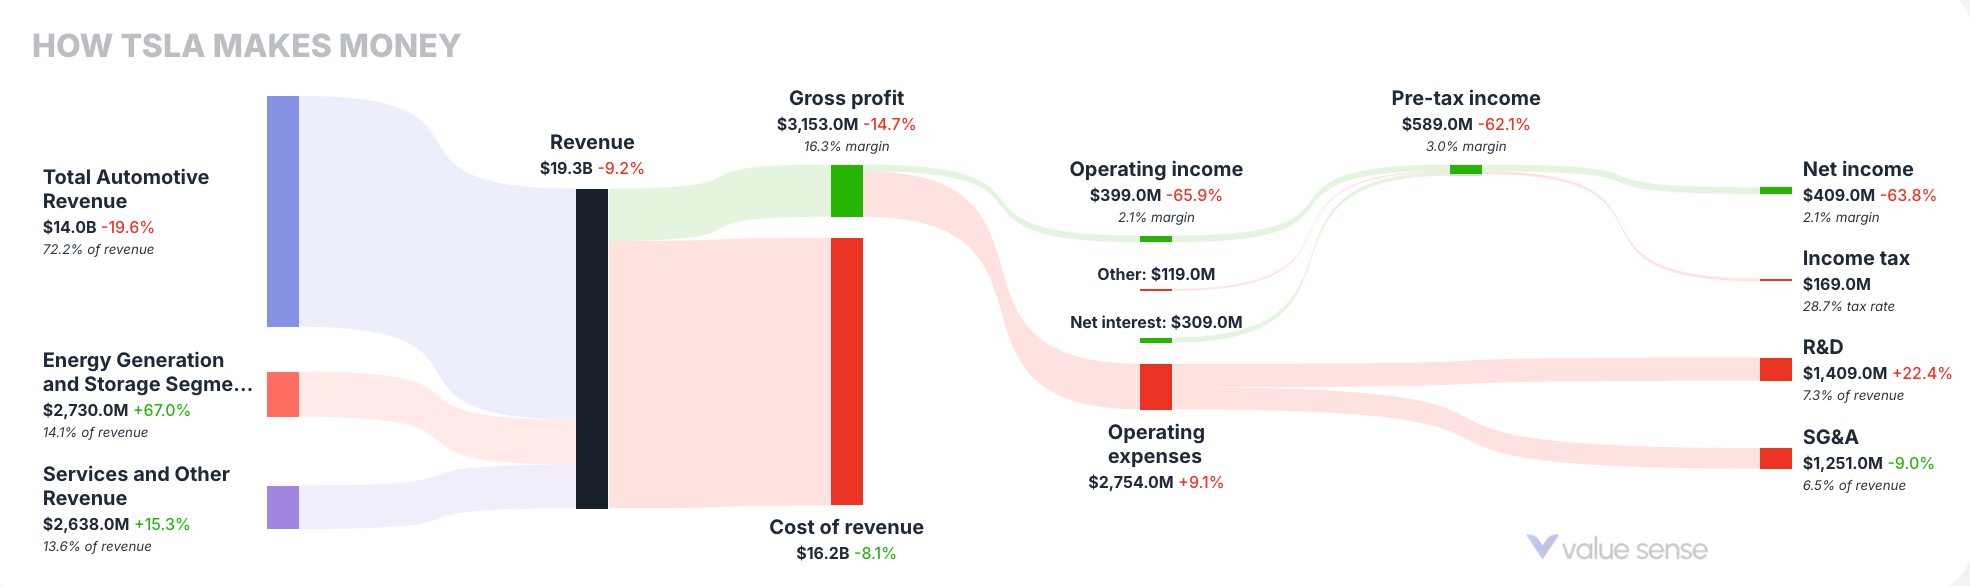
- Total Revenue: $19.3B (+5.2%)
- Automotive Revenue: $14.0B (+0.7%) – 72.5% of total revenue
- Energy Generation and Storage: $2.7B (+67.0%) – fastest-growing segment
- Services and Other Revenue: $2.6B (+5.3%) – 13.6% of revenue
- R&D Investment: $1.4B (+22.4%) – 7.5% of revenue
While automotive sales remain Tesla's core business, their energy segment is growing at nearly 10x the rate of their car business, highlighting the company's diversification strategy.
Comparative Analysis: R&D Spending vs. Growth
Tech companies throwing cash at R&D like it's confetti at a parade? Let's see who's getting bang for their buck:
- NVIDIA: 9.6% of revenue on R&D → 77.4% revenue growth (efficiency champion)
- Meta: 26.7% of revenue on R&D → 21.9% revenue growth (finally seeing returns)
- Microsoft: 12.0% of revenue on R&D → 15.7% revenue growth (steady Eddie)
- Google: 15.2% of revenue on R&D → 12.1% revenue growth (diminishing returns?)
- Amazon: 12.6% of revenue on R&D → 9.3% revenue growth (complexity tax)
- Apple: 6.7% of revenue on R&D → 10.0% revenue growth (lean machine)
- Tesla: 7.5% of revenue on R&D → 5.2% revenue growth (distracted driver?)
The takeaway? NVIDIA's focused AI chip strategy is crushing it while using less R&D than everyone except Apple and Tesla. Meanwhile, Meta's dumping over a quarter of its revenue into R&D and finally seeing some decent returns. It's not how much you spend—it's where you point it.
Profit Margin Leaders
Net income margins reveal which companies extract the most profit from their revenues:
- NVIDIA: 68.7% net income margin
- Microsoft: 36.8% net income margin
- Google: 38.3% net income margin
- Meta: 37.9% net income margin
- Apple: 29.2% net income margin
- Tesla: 21.3% net income margin
- Amazon: 8.9% net income margin
NVIDIA's extraordinary margin reflects its near-monopoly in AI chips, while Amazon's lower margin demonstrates the thin-margin reality of retail, even at massive scale. Meta maintains an impressive 37.9% net income margin despite its significant R&D investments, showcasing the incredible profitability of its advertising business model.
Conclusion: Diverse Paths to Tech Dominance
This analysis reveals several key insights about big tech's financial success:
- Specialized dominance pays: NVIDIA's focus on AI chips has delivered unparalleled growth and profitability.
- Services and subscriptions matter: All seven companies are investing in recurring revenue streams, with Apple, Microsoft, and Google showing strong results.
- Cloud is the common denominator: Every company except Tesla has significant cloud investments, with Microsoft, Amazon, and Google leading the way.
- Diversification vs. focus: Companies are balancing between specialization (NVIDIA, Meta) and diversification (Amazon, Google) with varying results.
- R&D efficiency matters more than volume: NVIDIA's targeted R&D delivers significantly better returns than Meta's broader investments.
As these tech giants continue evolving, their revenue models will likely become even more sophisticated, blending hardware, software, services, and data-driven insights to maintain their market dominance. Report this page